Due to some challenges with home remodeling issues we didn’t end up handing out candy this year.
We discovered a slow leak in one of the walls in our kitchen that caused some of our hardwood floor to warp, maybe a little more than a square meter. Since this was a very slow leak over time, insurance couldn’t say “here’s the event that caused it” and, thus, chalked it up to “normal wear and tear” which isn’t covered.
You can’t fix just a small section of a hardwood floor and we’ve got like 800 square feet of contiguous hardwood, so… all 800 square feet needed to be fully sanded and refinished. All out of pocket. We packed the entire first floor of the house into the garage and took a much-needed vacation to Universal Studios California and Disneyland for a week while the floor was getting refinished.
I had planned on putting the house back together, decorating, and getting right into Halloween when we came back. Unfortunately, when we got back we saw the floor was not done too well. Lots of flaws and issues in the work. It’s getting fixed, but it means we didn’t get to empty out the garage, which means I couldn’t get to the Halloween decorations. Between work and stress and everything else… candy just wasn’t in the cards. Sorry kids. Next year.
But we did make costumes - and we wore them in 90 degree heat in California for the Disney “Oogie Boogie Bash” party. So hot, but still very fun.
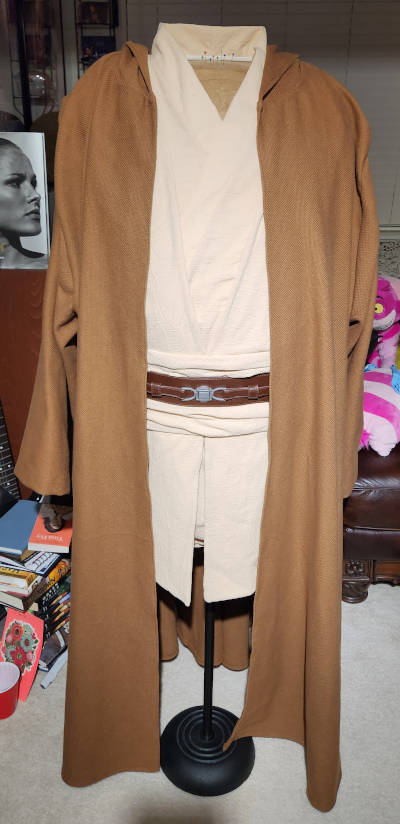
I used this Julie-Chantal pattern for a Jedi costume and it is really good. I’m decent at working with and customizing patterns, I’m not so great with drafting things from scratch.
I used a cotton gauze for the tunic, tabard, and sash. The robe is a heavy-weave upholstery fabric that has a really nice feel to it.
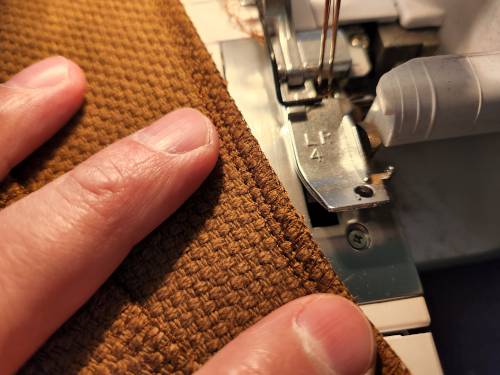
I added some magnet closures to it so it would stick together a bit nicer as well as some snaps to stick things in place. I definitely found while wearing it that it was required. All the belts and everything have a tendency to move a lot as you walk, sit, and stand. I think it turned out nicely, though.
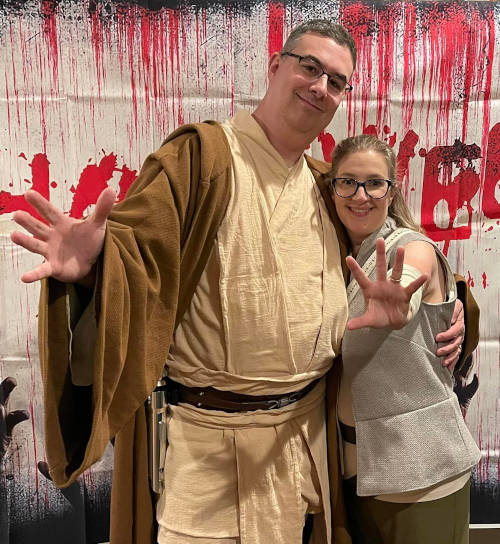
The whole family went in Star Wars garb. I don’t have a picture of Phoenix, but here’s me and Jenn at a Halloween party. Phoenix and Jenn were both Rey, but from different movies. You can’t really tell, but Jenn’s vest is also upholstery fabric with an amazing, rich texture. She did a great job on her costume, too.