
NDepend - Analyze Your Code
NDepend is a tool you can use to analyze your .NET code and find problem areas.It’s exceptionally helpful when working with a large codebase so you can see what’s going on - which components rely on which other components, which classes might not be single responsibility… that sort of thing. It gives you a lot of information.So much, you might be overwhelmed by the sheer volume at first until you start really understanding what you’re looking at. Let’s walk through it a little.
Install is easy- unzip and you’re done. Fire it up and you’ll find yourself at the Start Page.
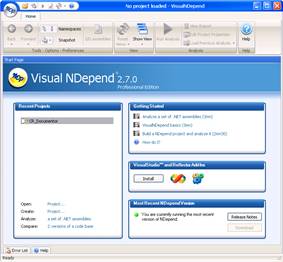
This is where you can create a new project, open an existing project, or watch some getting started videos. The interesting thing I liked about the Start Page (aside from the video links) was that you can install some add-ins for Visual Studio and Reflector right from there.
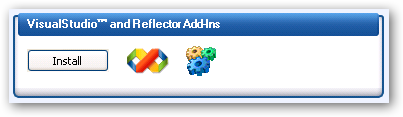
I’ll talk about what the add-ins do in a bit, but the ability to install add-ins right from the Start Page makes it nice and convenient.You can also get to this from the Options menu, but this gets it right up in front of you.
At the bottom of the Start Page you’ll see tabs for an Error List and a Help window. The Help window has some links to additional videos to help you get started. You will want to watch these Help videos before getting too far into NDependso you have an idea about what you will need to do. NDepend is big and can be intimidating. The videos help with that.
A couple of things I noticed about the Error List and Help windows: First, there’s no way to “pin” them on the Start Page, so as soon as your cursor leaves, they auto-hide. That can get frustrating as you’re navigating around. (Once you’re past the Start Page, they’re pinnable, but on the Start Page they’re not.) Second, the Help window arranges the available videos in a giant accordion control. This isn’t immediately apparent (at least, it wasn’t to me), so once you’ve expanded one of the sections of videos, you’ll wonder where the rest went. The scroll bar at the side of the accordion control (not the window, but the control) will help you out there.
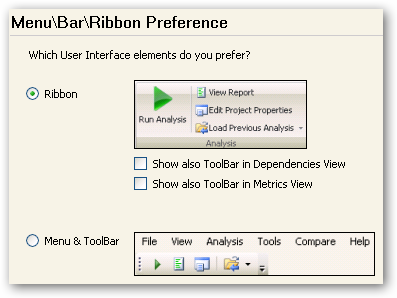
Before you go any further, go to the Options menu (Tools -> Options) and under “Menu\Bar\Ribbon Preference,” select the ribbon interface.The ribbon felt to me like it was easier to figure out than the standard menu/toolbar interface. The ribbon also felt like it gave more “guidance” on what my available options were at any given time, and you’ll want that.
Using NDepend is covered fairly well by the screencasts you can access in the Help menu, so I won’t cover every detail of usage. I recommend you watch the Help videos because it makes all the difference.
An NDepend project is what contains of the list of assemblies you want to analyze. Creating a new NDepend project is a very flexible process.You can do it based on a Visual Studio solution, you can drag and drop assemblies, you can browse for assemblies, or do a combination of several of these.
The project saves paths to each assembly you want to analyze. There is an option to let you save paths in the project as relative paths (relative to the location of the NDepend project). The relative path option is not the default and it’s not obvious how to change your project to save relative paths.If you’re going to use this project on any machine but your own, you’ll want the relative path option set. You need to expand the folder view and select the “Relative path mode” checkbox.
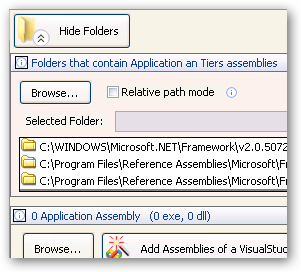
Unfortunately, relative path mode seems to be “all or nothing.”While .NET framework assemblies always get an absolute path, all of the other assemblies in your project, including dependencies, are all either relative or absolute. You can’t save some assemblies with relative paths and some without, and that can be a problem when you’re looking at projects like Visual Studio add-ins that use some assemblies like EnvDTE
- they get saved with relative paths. You can fix this by manually modifying the project file (it’s XML), but NDepend won’t automatically pick up your changesif you do that - you’ll need to manually reload the project. This is probably an edge case, but the first project I analyzed was a VS add-in because that’s what I happened to be working on at the time.
Once you’ve created a project and run the analysis for the first time, that’s where the fun starts, but that’s also where it can get overwhelming. For the first time user, you’ll do the analysis, you’ll see the report come up, and then you’ll sit there for a bit wondering, “Now what? What do I do with all this information?”I think that’s my only real complaint with the product. With a tool like FxCop, you know you’ve broken some rules and it tells you what to do about it. With NDepend, the “what to do about it” is very subjective - whether or not you need to do anything at all is entirely up to you, and then what you do based on your decision is also entirely up to you. Granted, the two tools perform very different analysis, but the idea stands: There’s nothing that takes you from “I just ran analysis” to “Here’s a list of actions to take.”I think if that gap could somehow be bridged, it would make this a more accessible tool.
Once you run the analysis, you’ll be presented with a report and the GUI will update with the data.
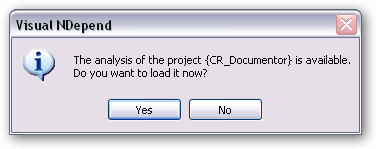
Note: If you run the analysis again, the report will again pop up, but the GUI won’t automatically update - instead, you’ll get a dialog letting you know there’s new analysis available and asking if you want to update. That’s a little confusing - I just ran the thing; why wouldn’t I want to update?
Anyway, once you’ve got the analysis run, you’re going to get a pretty busy interface that comes up with a lot of information. If you’ve watched the videos, you have an idea of what all this means. If you haven’t watched the videos, now is the time to do that. NDepend is not a tool you can just wander around randomly and “figure out.”
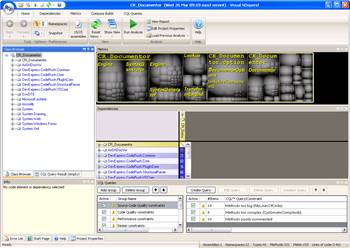
Using the ribbon interface, you can pretty easily switch between views to analyze dependencies, look at various metrics, compare two sets of analysis to see what’s changed, and do some ad-hoc querying against the analysis to dig deeper and learn more about your code. Use the tabs at the top to switch the ribbon to a different mode, and the “Reset Views” button will set the various information windows up to help you better visualize what you want. You’ll use “Reset Views” a lot.The only problem with “Reset Views” is there is no way to customize the “default view” for a given “mode,”so if you set the view up slightly differently, switch to a different view (say, from “Dependencies” to “Metrics”), and you’ll never get your customized view back again. That can get frustrating, but I’ve learned to just live with the default views. I’m hoping a future version of the product lets me customize those views.
The Metrics window is the most visually strikingpart of any of the views, but it’s also the most confusing. This is that gray-block looking window:
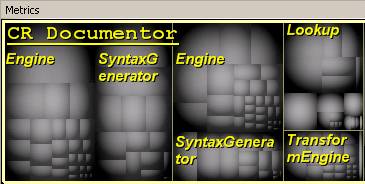
This is an interesting visualization of the makeup of your assemblies. What the blocks represent is based on what you have the view set to at the time, but in the above example, each block is one method. The relative size of each block illustrates the relative size of the method in lines of code - larger blocks mean longer methods. Hovering your mouse over a block will let you know what that block represents, and as you query your code, this view lights up to show you which bits match the query you just entered. In all, a pretty cool way to visualize the makeup of your code.
That said, I’ve never been a big fan of the grayscale gradient boxes. The gradient makes it hard for me to see the edges of each block and when you’re looking at a really large project, this blends together to become more of a “texture” than a visualization. Throw the text on top of that and it gets a little overwhelming. I wonder if alternative visualization mechanisms might be available in the future, like a red-to-blue hot-to-cold sort of thing, or maybe just solid colors with hard lines around the edge of each block.
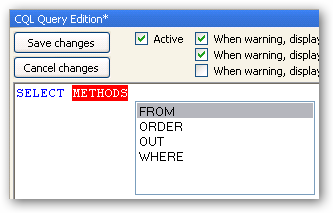
The major feature of NDepend is really the CQL (Code Query Language) ad-hoc querying you can do.For example, if you want to find all of the protected methods that start with “C” that have over 10 lines of code, you can do that:
SELECT METHODS WHERE IsProtected AND NbLinesOfCode> 10 AND NameLike “\^C”
Pretty cool, eh? When you do that, you’ll see a query result window that lists the items that match your query, and the Metrics window will highlight the items so you can see the results visually. Oh, and don’t worry too much about the trouble of learning CQL - it’s a lot like SQL, and there’s some great IntelliSense in the query window:
Once you’ve gotten your queries set up (and there are lots of good ones that come out-of-the-box when you create your project), you’ll probably want to integrate this into your continuous integration build. NDepend comes with both NAnt and MSBuild tasks to help you get this going in CI.It’s not hard to get going, but the documentation on the tasks is light(almost non-existent) so you may need to use Reflector to see what parameters the tasks allow you to pass in. It’d be nice to see a little more robust doc on these.
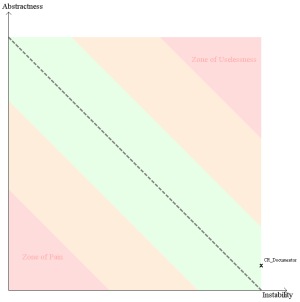
The reports that NDepend generates are very robust and fully customizable.You can either select some out-of-the-box options (recommended, particularly at the start) or you can customize everything down to the look and feel using XSL. The report itself takes the form of an HTML page with lots of charts and graphs. My favorite part of the report is the Abstractness vs. Instabilitygraph (which is also the easiest to understand) where you can see which assemblies you have may need some refactoring to get them out of the “Zone of Pain” or the “Zone of Uselessness.”
The only issue I really had with the reports was, when viewing them with IE, I got the “security warning” telling me the HTML could be harmful to my computer. That could be fixed pretty easily with a Mark of the Web, so if you want to customize your report, you can probably get rid of that.
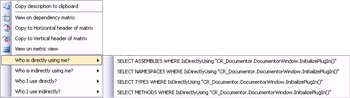
Finally, the Visual Studio and Reflector add-ins bring all this full circle. As you’re working on your code, you may be interested in doing some analysis on that code. You might wonder, for example, “Who’s using this method?” Rather than having to write that CQL yourself, you can right-click your way to freedom and leisure.
You can do this same right-click action in Reflector.Again, very easy, and very cool.
I love NDepend, and I highly recommend it.It tells you all sorts of things that you really do need to know about your code. It’s a little tough to get started, so you have to be patient, but once you’re in, you’re flying. Learn about your code and make it better. It’ll be well worth your time, I promise.