
Deploy Standalone Kayenta with an Azure Storage Backend
Kayenta is the subcomponent of Spinnaker that handles automated canary analysis during a deployment. It reads from your metric sources and compares the stats from an existing deployed service against a new version of the service to see if there are anomalies or problems, indicating the rollout should be aborted if the new service fails to meet specified tolerances.
I’m a huge fan of Spinnaker, but sometimes you already have a full CI/CD system in place and you really don’t want to replace all of that with Spinnaker. You really just want the canary part of Spinnaker. Luckily, you can totally use Kayenta as a standalone service. They even have some light documentation on it!
In my specific case, I also want to use Azure Storage as the place where I store the data for Kayenta - canary configuration, that sort of thing. It’s totally possible to do that, but, at least at the time of this writing, the hal config canary Halyard command does not have Azure listed and the docs don’t cover it.
So there are a couple of things that come together here, and maybe all of it’s interesting to you or maybe only one piece. In any case, here’s what we’re going to build:
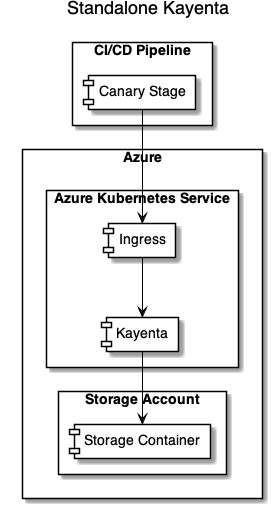
- A Kubernetes ingress to allow access to Kayenta from your CI/CD pipeline.
- A deployment of the Kayenta microservice.
- Kayenta configured to use an Azure Storage Account to hold its configuration and such.
Things I’m not going to cover:
- How exactly your CI/CD canary stage needs to work.
- How long a canary stage should last.
- How exactly you should configure Kayenta (other than the Azure part).
- Which statistics you should monitor for your services to determine if they “pass” or “fail.”
- Securing the Kayenta ingress so only authenticated/authorized access is allowed.
This stuff is hard and it gets pretty deep pretty quickly. I can’t cover it all in one go. I don’t honestly have answers to all of it anyway, since a lot of it depends on how your build pipeline is set up, how your app is set up, and what your app does. There’s no “one-size-fits-all.”
Let’s do it.
Deployment
First, provision an Azure Storage account. Make sure you enable HTTP access because right now Kayenta requires HTTP and not HTTPS.
You also need to provision a container in the Azure Storage account to hold the Kayenta contents.
# I love me some PowerShell, so examples/scripts will be PowerShell.
# Swap in your preferred names as needed.
$ResourceGroup = "myresourcegroup"
$StorageAccountName = "kayentastorage"
$StorageContainerName = "kayenta"
$Location = "westus2"

# Create the storage account with HTTP enabled.
az storage account create `
  --name $StorageAccountName `
  --resoure-group $ResourceGroup `
  --location $Location `
  --https-only false `
  --sku Standard_GRS

# Get the storage key so you can create a container.
$StorageKey = az storage account keys list `
  --account-name $StorageAccountName `
  --query '[0].value' `
  -o tsv

# Create the container that will hold Kayenta stuff.
az storage container create `
  --name $StorageContainerName `
  --account-name $StorageAccountName `
  --account-key $StorageKey
Let’s make a namespace in Kubernetes for Kayenta so we can put everything we’re deploying in there.
# We'll use the namespace a lot, so a variable
# for that in our scripting will help.
$Namespace = "kayenta"
kubectl create namespace $Namespace
Kayenta needs Redis. We can use the Helm chart to deploy a simple Redis instance. Redis must not be in clustered mode, and there’s no option for providing credentials.
helm repo add bitnami https://charts.bitnami.com/bitnami

# The name of the deployment will dictate the name of the
# Redis master service that gets deployed. In this example,
# 'kayenta-redis' as the deployment name will create a
# 'kayenta-redis-master' service. We'll need that later for
# Kayenta configuration.
helm install kayenta-redis bitnami/redis `
  -n $Namespace `
  --set cluster.enabled=false `
  --set usePassword=false `
  --set master.persistence.enabled=false
Now let’s get Kayenta configured. This is a full, commented version of a Kayenta configuration file. There’s also a little doc on Kayenta configuration that might help. What we’re going to do here is put the kayenta.yml configuration into a Kubernetes ConfigMap so it can be used in our service.
Here’s a ConfigMap YAML file based on the fully commented version, but with the extra stuff taken out. This is also where you’ll configure the location of Prometheus (or whatever) where Kayenta will read stats. For this example, I’m using Prometheus with some basic placeholder config.
apiVersion: v1
kind: ConfigMap
metadata:
  name: kayenta
  namespace: kayenta
data:
  kayenta.yml: |-
    server:
      port: 8090

    # This should match the name of the master service from when
    # you deployed the Redis Helm chart earlier.
    redis:
      connection: redis://kayenta-redis-master:6379

    kayenta:
      atlas:
        enabled: false

      google:
        enabled: false

    # This is the big one! Here's where you configure your Azure Storage
    # account and container details.
      azure:
        enabled: true
        accounts:
          - name: canary-storage
            storageAccountName: kayentastorage
            # azure.storageKey is provided via environment AZURE_STORAGEKEY
            # so it can be stored in a secret. You'll see that in a bit.
            # Don't check in credentials!
            accountAccessKey: ${azure.storageKey}
            container: kayenta
            rootFolder: kayenta
            endpointSuffix: core.windows.net
            supportedTypes:
              - OBJECT_STORE
              - CONFIGURATION_STORE

      aws:
        enabled: false

      datadog:
        enabled: false

      graphite:
        enabled: false

      newrelic:
        enabled: false

    # Configure your Prometheus here. Or if you're using something else, disable
    # Prometheus and configure your own metrics store. The important part is you
    # MUST have a metrics store configured!
      prometheus:
        enabled: true
        accounts:
        - name: canary-prometheus
          endpoint:
            baseUrl: http://prometheus:9090
          supportedTypes:
            - METRICS_STORE

      signalfx:
        enabled: true

      wavefront:
        enabled: false

      gcs:
        enabled: false

      blobs:
        enabled: true

      s3:
        enabled: false

      stackdriver:
        enabled: false

      memory:
        enabled: false

      configbin:
        enabled: false

      remoteJudge:
        enabled: false

    # Enable the SCAPE endpoint that has the same user experience that the Canary StageExecution in Deck/Orca has.
    # By default this is disabled - in standalone we enable it!
      standaloneCanaryAnalysis:
        enabled: true

      metrics:
        retry:
          series: SERVER_ERROR
          statuses: REQUEST_TIMEOUT, TOO_MANY_REQUESTS
          attempts: 10
          backoffPeriodMultiplierMs: 1000

      serialization:
        writeDatesAsTimestamps: false
        writeDurationsAsTimestamps: false

    management.endpoints.web.exposure.include: '*'
    management.endpoint.health.show-details: always

    keiko:
      queue:
        redis:
          queueName: kayenta.keiko.queue
          deadLetterQueueName: kayenta.keiko.queue.deadLetters

    spectator:
      applicationName: ${spring.application.name}
      webEndpoint:
        enabled: true

    swagger:
      enabled: true
      title: Kayenta API
      description:
      contact:
      patterns:
        - /admin.*
        - /canary.*
        - /canaryConfig.*
        - /canaryJudgeResult.*
        - /credentials.*
        - /fetch.*
        - /health
        - /judges.*
        - /metadata.*
        - /metricSetList.*
        - /metricSetPairList.*
        - /metricServices.*
        - /pipeline.*
        - /standalone.*
Save that and deploy it to the cluster.
kubectl apply -f kayenta-configmap.yml
You’ll notice in the config we just put down that we did not include the Azure Storage acccount key. Assuming we want to commit that YAML to a source control system at some point, we definitely don’t want credentials in there. Instead, let’s use a Kubernetes secret for the Azure Storage account key.
# Remember earlier we got the storage account key for creating
# the container? We're going to use that again.
kubectl create secret generic azure-storage `
  -n $Namespace `
  --from-literal=storage-key="$StorageKey"
It’s deployment time! Let’s get a Kayenta container into the cluster! Obviously you can tweak all the tolerances and affinities and node selectors and all that to your heart’s content. I’m keeping the example simple.
apiVersion: apps/v1
kind: Deployment
metadata:
  name: kayenta
  namespace: kayenta
  labels:
    app.kubernetes.io/name: kayenta
spec:
  replicas: 1
  selector:
    matchLabels:
      app.kubernetes.io/name: kayenta
  template:
    metadata:
      labels:
        app.kubernetes.io/name: kayenta
    spec:
      containers:
        - name: kayenta
          # Find the list of tags here: https://console.cloud.google.com/gcr/images/spinnaker-marketplace/GLOBAL/kayenta?gcrImageListsize=30
          # This is just the tag I've been using for a while. I use one of the images NOT tagged
          # with Spinnaker because the Spinnaker releases are far slower.
          image: "gcr.io/spinnaker-marketplace/kayenta:0.17.0-20200803200017"
          env:
            # If you need to troubleshoot, you can set the logging level by adding
            # -Dlogging.level.root=TRACE
            # Without the log at DEBUG level, very little logging comes out at all and
            # it's really hard to see if something goes wrong. If you don't want that
            # much logging, go ahead and remove the log level option here.
            - name: JAVA_OPTS
              value: "-XX:+UnlockExperimentalVMOptions -Dlogging.level.root=DEBUG"
            # We can store secrets outside config and provide them via the environment.
            # Insert them into the config file using ${dot.delimited} versions of the
            # variables, like ${azure.storageKey} which we saw in the ConfigMap.
            - name: AZURE_STORAGEKEY
              valueFrom:
                secretKeyRef:
                  name: azure-storage
                  key: storage-key
          ports:
            - name: http
              containerPort: 8090
              protocol: TCP
          livenessProbe:
            httpGet:
              path: /health
              port: http
          readinessProbe:
            httpGet:
              path: /health
              port: http
          volumeMounts:
            - name: config-volume
              mountPath: /opt/kayenta/config
      volumes:
        - name: config-volume
          configMap:
            name: kayenta
And let’s save and apply.
kubectl apply -f kayenta-deployment.yml
If you have everything wired up right, the Kayenta instance should start. But we want to see something happen, right? Without kubectl port-forward?
Let’s put a LoadBalancer service in here so we can access it. I’m going to show the simplest Kubernetes LoadBalancer here, but in your situation you might have, say, an nginx ingress in play or something else. You’ll have to adjust as needed.
apiVersion: v1
kind: Service
metadata:
  name: kayenta
  namespace: kayenta
  labels:
    app.kubernetes.io/name: kayenta
spec:
  ports:
    - port: 80
      targetPort: http
      protocol: TCP
      name: http
  selector:
    app.kubernetes.io/name: kayenta
  type: LoadBalancer
Let’s see it do something. You should be able to get the public IP address for that LoadBalancer service by doing:
kubectl get service/kayenta -n $Namespace
You’ll see something like this:
NAME         TYPE           CLUSTER-IP     EXTERNAL-IP      PORT(S)    AGE
kayenta      LoadBalancer   10.3.245.137   104.198.205.71   80/TCP     54s
Take note of that external IP and you can visit the Swagger docs in a browser: http://104.198.205.71/swagger-ui.html
If it’s all wired up, you should get some Swagger docs!
The first operation you should try is under credentials-controller - GET /credentials. This will tell you what metrics and object stores Kayenta thinks it’s talking to. The result should look something like this:
[
  {
    "name": "canary-prometheus",
    "supportedTypes": [
      "METRICS_STORE"
    ],
    "endpoint": {
      "baseUrl": "http://prometheus"
    },
    "type": "prometheus",
    "locations": [],
    "recommendedLocations": []
  },
  {
    "name": "canary-storage",
    "supportedTypes": [
      "OBJECT_STORE",
      "CONFIGURATION_STORE"
    ],
    "rootFolder": "kayenta",
    "type": "azure",
    "locations": [],
    "recommendedLocations": []
  }
]
If you are missing the canary-storage account pointing to azure - that means Kayenta can’t access the storage account or it’s otherwise misconfigured. I found the biggest gotcha here was that it’s HTTP-only and that’s not the default for a storage account if you create it through the Azure portal. You have to turn that on.
Troubleshooting
What do you do if you can’t figure out why Kayenta isn’t connecting to stuff?
Up in the Kubernetes deployment, you’ll see the logging is set up at the DEBUG level. The logging is pretty good at this level. You can use kubectl logs to get the logs from the Kayenta pods or, better, use stern for that Those logs are going to be your secret. You’ll see errors that pretty clearly indicate whether there’s a DNS problem or a bad password or something similar.
If you still aren’t getting enough info, turn the log level up to TRACE. It can get noisy, but you’ll only need it for troubleshooting.
Next Steps
There’s a lot you can do from here.
Canary configuration: Actually configuring a canary is hard. For me, it took deploying a full Spinnaker instance and doing some canary stuff to figure it out. There’s a bit more doc on it now, but it’s definitely tricky. Here’s a pretty basic configuration where we just look for errors by ASP.NET microservice controller. No, I can not help or support you in configuring a canary. I’ll give you this example with no warranties, expressed or implied.
{
  "canaryConfig": {
    "applications": [
      "app"
    ],
    "classifier": {
      "groupWeights": {
        "StatusCodes": 100
      },
      "scoreThresholds": {
        "marginal": 75,
        "pass": 75
      }
    },
    "configVersion": "1",
    "description": "App Canary Configuration",
    "judge": {
      "judgeConfigurations": {
      },
      "name": "NetflixACAJudge-v1.0"
    },
    "metrics": [
      {
        "analysisConfigurations": {
          "canary": {
            "direction": "increase",
            "nanStrategy": "replace"
          }
        },
        "groups": [
          "StatusCodes"
        ],
        "name": "Errors By Controller",
        "query": {
          "customInlineTemplate": "PromQL:sum(increase(http_requests_received_total{app='my-app',azure_pipelines_version='${location}',code=~'5\\\\d\\\\d|4\\\\d\\\\d'}[120m])) by (action)",
          "scopeName": "default",
          "serviceType": "prometheus",
          "type": "prometheus"
        },
        "scopeName": "default"
      }
    ],
    "name": "app-config",
    "templates": {
    }
  },
  "executionRequest": {
    "scopes": {
      "default": {
        "controlScope": {
          "end": "2020-11-20T23:01:09.3NZ",
          "location": "baseline",
          "scope": "control",
          "start": "2020-11-20T21:01:09.3NZ",
          "step": 2
        },
        "experimentScope": {
          "end": "2020-11-20T23:01:09.3NZ",
          "location": "canary",
          "scope": "experiment",
          "start": "2020-11-20T21:01:09.3NZ",
          "step": 2
        }
      }
    },
    "siteLocal": {
    },
    "thresholds": {
      "marginal": 75,
      "pass": 95
    }
  }
}
Integrate with your CI/CD pipeline: Your deployment is going to need to know how to track the currently deployed vs. new/canary deployment. Statistics are going to need to be tracked that way, too. (That’s the same as if you were using Spinnaker.) I’ve been using the KubernetesManifest@0 task in Azure DevOps, setting trafficSplitMethod: smi and making use of the canary control there. A shell script polls Kayenta to see how the analysis is going.
How you do this for your template is very subjective. Pipelines at this level are really complex. I’d recommend working with Postman or some other HTTP debugging tool to get things working before trying to automate it.
Secure it!: You probably don’t want public anonymous access to the Kayenta API. I locked mine down with oauth2-proxy and Istio but you could do it with nginx ingress and oauth2-proxy or some other mechanism.
Put a UI on it!: As you can see, configuring Kayenta canaries without a UI is actually pretty hard. Nike has a UI for standalone Kayenta called “Referee”. At the time of this writing there’s no Docker container for it so it’s not as easy to deploy as you might like. However, there is a Dockerfile gist that might be helpful. I have not personally got this working, but it’s on my list of things to do.
Huge props to my buddy Chris who figured a lot of this out, especially the canary configuration and Azure DevOps integration pieces.